R语言数据展现——箱线图,热力图
上文为大家介绍的是R语言中的柱形图,点图,饼图,直方图,相信大家已经对R语言有一定的了解了,接下来小编就给大家说说关于箱线图,热力图。
一、观测值数量决定箱体宽度
boxplot(Cu ~ Source, data =metals,varwidth=TRUE,
main="Summary of Copper concentrations by Site")

二、改变箱型风格
boxplot(metals[,-1],border = "white",col = "black",boxwex = 0.3,
medlwd=1, whiskcol="black",staplecol="black",outcol="red",cex=0.3,outpch=19,
main="Summary of metal concentrations by Site")
grid(nx=NA,ny=NULL,col="gray",lty="dashed")

三、显示观测数量
b<-boxplot(metals[,-1],xaxt="n",border = "white",col = "black",
boxwex=0.3,medlwd=1,whiskcol="black",staplecol="black",outcol="red",cex=0.3,outpch=19,
main="Summary of metal concentrations by Site")axis(side=1,at=1:length(b$names),
labels=paste(b$names,"\n(n=",b$n,")",sep=""),mgp=c(3,2,0))

四、分割数据
cuts<-c(0,40,80)
Y<-split(x=metals$Cu, f=findInterval(metals$Cu, cuts))
boxplot(Y,xaxt="n",border = "white",col = "black",boxwex = 0.3,
medlwd=1,whiskcol="black",staplecol="black",outcol="red",cex=0.3,outpch=19,
main="Summary of Copper concentrations",xlab="Concentration ranges",las=1)
axis(1,at=1:4,labels=c("Below 0","0 to 40","40 to 80","Above 80"),
lwd=0,lwd.ticks=1,col="gray")

五、热力图
par(mar = c(5,1,4,7))
image(x=1, y=0:length(breaks2),z=t(matrix(breaks2))*1.001,
col=pal[1:length(breaks)-1],axes=FALSE,breaks=breaks,xlab="", ylab="",xaxt="n")
axis(4,at=0:(length(breaks2)-1), labels=breaks2, col="white",las=1)
abline(h=c(1:length(breaks2)),col="white",lwd=2,xpd=F)

关于R语言数据展现——箱线图,热力图的讲述就到这里了,上述的内容只是截取了资料中的一部分,如需获取完整的资料,可通过关注微信公众号后联系客服获取。
想要了解更多的资料、信息,可持续关注我们,我们将为大家提供有价值、有需求的材料。为大家在整理数据时省去烦恼。
 打开微信“扫一扫”,打开网页后点击屏幕右上角分享按钮

-
论文打印要求是什么,单面还是双面? 132257
-
 ieee论文什么水平,含金量如何? 71462
-
大肠杆菌转化实验技术分享 2019.06.24 15:38
-
我做医学科研的体会 2019.06.24 14:59
-
SCI英文写作中常用句型汇总 2019.06.24 11:13
-
医学研究生的科研开题报告怎么写 2019.06.21 16:17
-
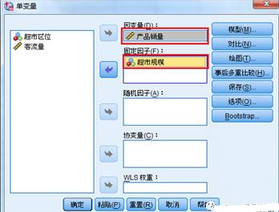 单变量方差分析之spss实现步骤
 -
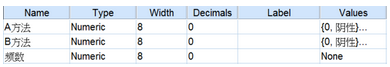
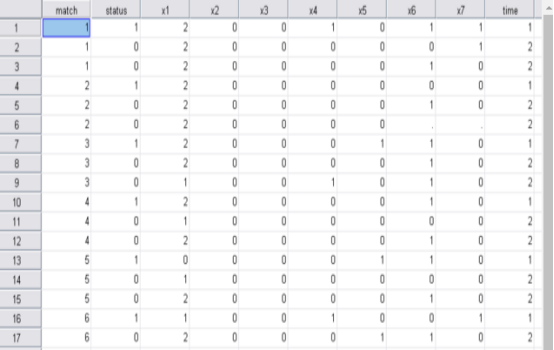 如何用SPSS处理1:N匹配的病例对照研究资料
 -
 配对卡方检验与一致性检验的SPSS操作步骤
